All datasets › Crime
Cybercrime in the News 2019–2026: article-level dataset and coverage tables
A dataset of cybercrime and online-fraud news from a global news index, January 2019 – July 2026, built with the Prism News API (historical and real-time news, https://radar-api.fliarbi.com/news). Every row is one news article about cybercrime, with its date, location, tone, editorial priority, themes and the organisations it names, plus a link that returns the full article through the API.
Download
Data-platform copies are being published; links appear here as they go live.
Key findings
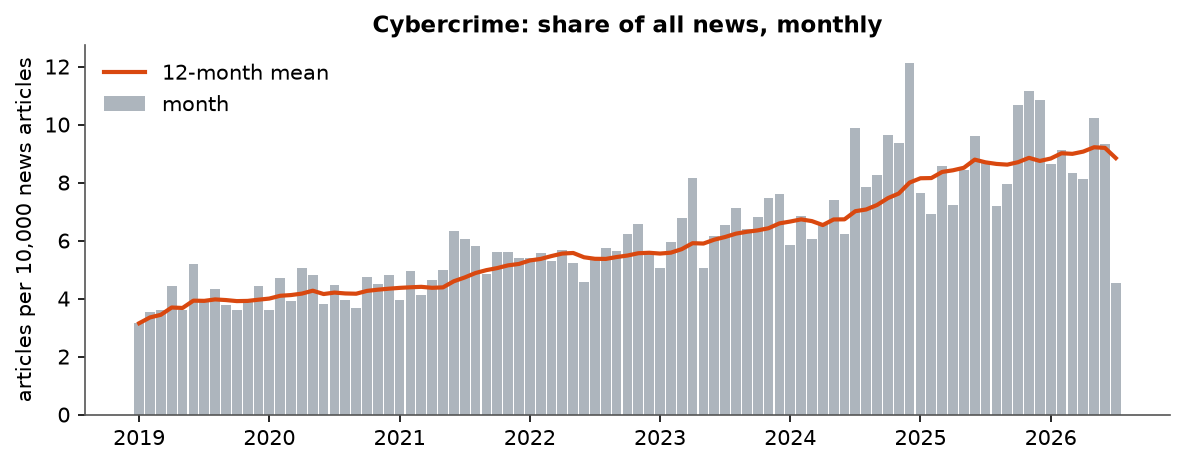
In a global news index covering January 2019 to July 2026, cybercrime and online fraud took 8.5 of every 10,000 news articles in 2025, against 3.95 in 2019, a 2.15-fold rise in the topic's share of the news.
Basis: Annual matched articles divided by all articles in the index for the same year; the share rose in every year from 2019 to 2025.
Of cybercrime articles carrying a tone label between January 2023 and July 2026, 81.4% were negative in tone, 2.42 times the 33.6% negative share across all news in the same index.
Basis: Top sentiment label of each article, grouped into negative, neutral and positive; 99.7% of sampled articles carry a label.
A machine-assigned editorial priority rating placed 86.2% of cybercrime articles at critical priority (7 or higher on a 1–9 scale) between January 2023 and July 2026, 2.02 times the 42.6% share for all news.
Basis: Top priority label per article; critical = priority ≥ 7.
Human-trafficking prevention and prosecution appeared in 4.24% of themed cybercrime articles between January 2023 and July 2026, 26.86 times its frequency in all themed news.
Basis: Theme labels assigned to each article (1,709 articles); lift against all themed news.
More than half (53.19%) of themed cybercrime articles between January 2023 and July 2026 carried the theme of cybercrime law and digital forensics, 246.14 times its frequency in all themed news.
Basis: Theme labels assigned to each article (21,438 articles); lift against all themed news.
Charts and maps
Coverage by country
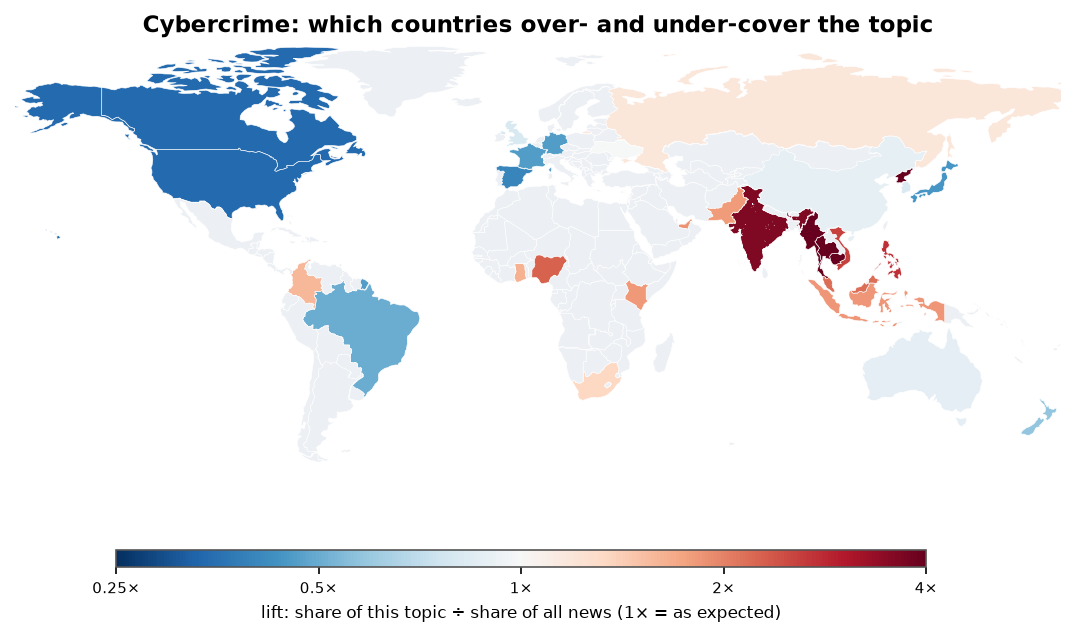
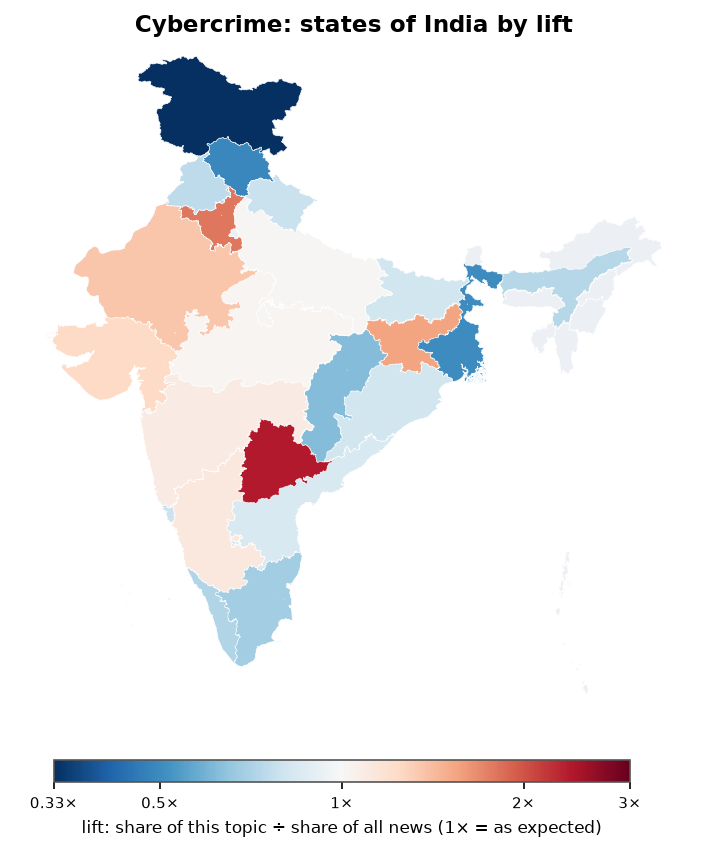
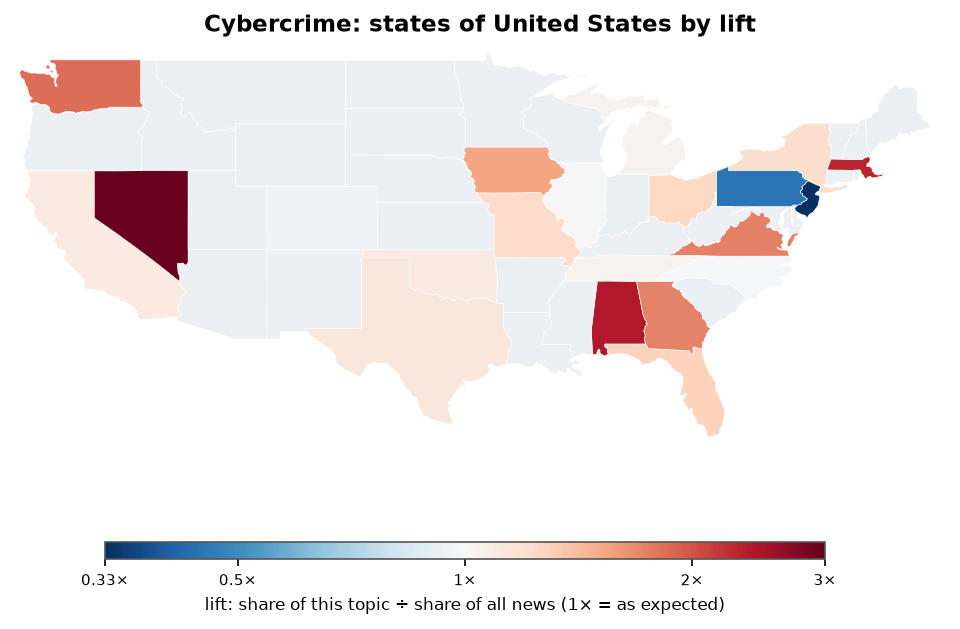
Primary location of located articles, January 2023 – July 2026. Lift = the country's share of this topic's news ÷ its share of all located news (above 1 = over-covered).
| Country | Articles | Share | Lift |
|---|---|---|---|
| India | 14,069 | 47.99% | 3.64 |
| United States | 4,837 | 16.5% | 0.34 |
| United Kingdom | 1,377 | 4.7% | 0.8 |
| Nigeria | 911 | 3.11% | 2.27 |
| China | 680 | 2.32% | 0.88 |
| Australia | 544 | 1.86% | 0.87 |
| Singapore | 509 | 1.74% | 1.95 |
| United Arab Emirates | 358 | 1.22% | 1.87 |
| Thailand | 339 | 1.16% | 6.1 |
| France | 267 | 0.91% | 0.46 |
| Russia | 261 | 0.89% | 1.18 |
| Philippines | 255 | 0.87% | 2.76 |
| Pakistan | 241 | 0.82% | 1.81 |
| Ghana | 232 | 0.79% | 1.64 |
| Canada | 215 | 0.73% | 0.34 |
Use the API
This dataset was built with the Prism News API, which serves historical and real-time news. Install the command-line client, log in with an API key, and query the topic yourself:
curl -fsSL https://raw.githubusercontent.com/fliarbi/prism-news-api/main/scripts/install.sh | bash
prism-news login
prism-news trends "cybercrime" --granularity monthly --tableCite
Fliar BI. Cybercrime in the News 2019–2026: article-level dataset and coverage tables. January 2019 – July 2026. https://fliarbi.github.io/news-datasets/cybercrime/