All datasets › Disasters
Tornadoes in the News 2019–2026: article-level dataset and coverage tables
A dataset of tornado news from a global news index, January 2019 – July 2026, built with the Prism News API (historical and real-time news, https://radar-api.fliarbi.com/news). Every row is one news article about tornadoes, with its date, location, tone, editorial priority, themes and the organisations it names, plus a link that returns the full article through the API.
Download
Data-platform copies are being published; links appear here as they go live.
Key findings
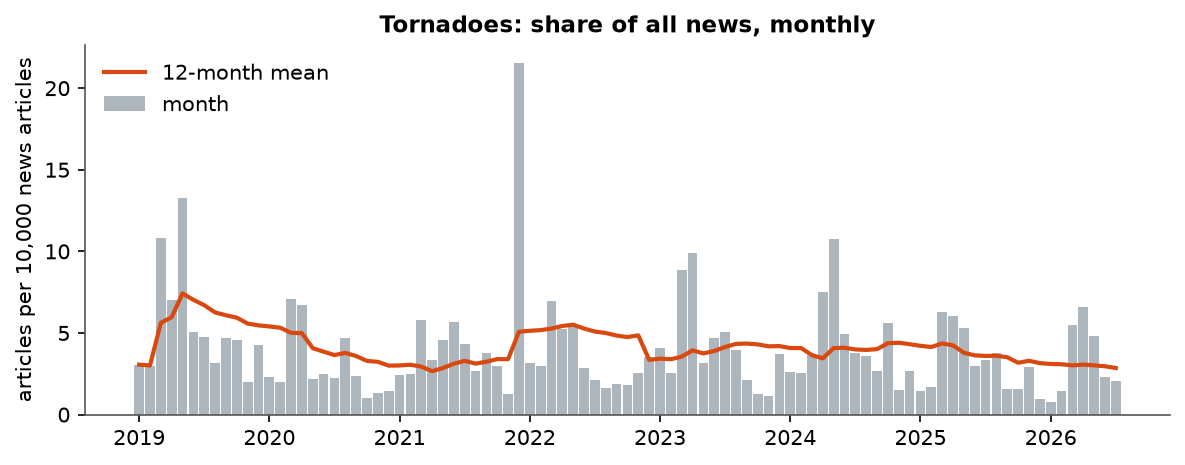
In a global news index covering January 2019 to July 2026, an average of 41.7% of each year's tornado coverage was published in March, April and May, against 25% if coverage were spread evenly across the year.
Basis: Within-year month shares of matched articles, averaged over the complete years 2019–2025; March alone held 15.28% and November, the quietest month, 3.73%.
Tornadoes took a 45.6% smaller share of news coverage in 2020 than in 2019 (2.98 against 5.48 articles per 10,000 news articles), the lowest annual share between 2019 and 2025.
Basis: Annual tornado articles divided by all articles in the index for the same year.
December 2021, the month of the tornado outbreak of 10–11 December in the central and southern United States, was the month in which tornadoes took their largest share of global news between January 2019 and July 2026, at 21.57 articles per 10,000, 4.3 times the share for 2021 as a whole.
Basis: Monthly tornado articles per 10,000 news articles, every month from January 2019 to July 2026 (2,987 articles in December 2021).
Of tornado articles carrying a tone label between January 2023 and July 2026, 74.5% were negative in tone, 2.22 times the 33.6% negative share across all news in the same index.
Basis: Top sentiment label of each article, grouped into negative, neutral and positive; 99.7% of sampled articles carry a label.
A machine-assigned news-priority rating placed 70.9% of tornado articles at critical priority (7 or higher on a 1–9 scale) between January 2023 and July 2026, 1.66 times the 42.6% share for all news.
Basis: Top priority label per article; critical = priority ≥ 7.
Charts and maps
Coverage by country
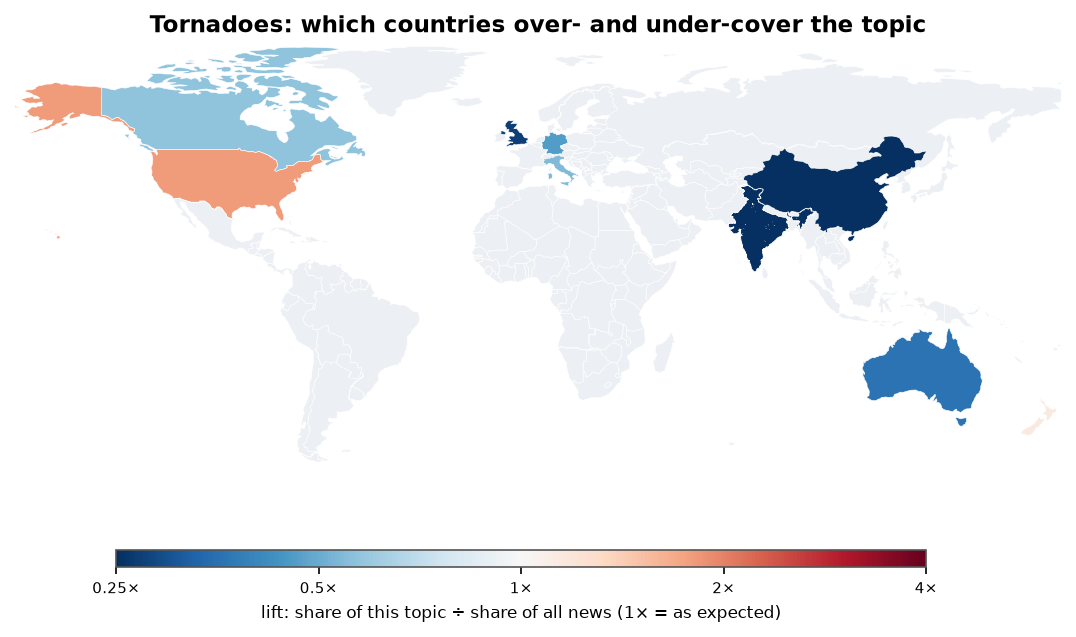
Primary location of located articles, January 2023 – July 2026. Lift = the country's share of this topic's news ÷ its share of all located news (above 1 = over-covered).
| Country | Articles | Share | Lift |
|---|---|---|---|
| United States | 17,225 | 87.74% | 1.81 |
| United Kingdom | 306 | 1.56% | 0.27 |
| India | 241 | 1.23% | 0.09 |
| Canada | 239 | 1.22% | 0.57 |
| Australia | 151 | 0.77% | 0.36 |
| New Zealand | 145 | 0.74% | 1.14 |
| China | 131 | 0.67% | 0.25 |
| Germany | 107 | 0.55% | 0.46 |
| Italy | 103 | 0.52% | 0.54 |
Use the API
This dataset was built with the Prism News API, which serves historical and real-time news. Install the command-line client, log in with an API key, and query the topic yourself:
curl -fsSL https://raw.githubusercontent.com/fliarbi/prism-news-api/main/scripts/install.sh | bash
prism-news login
prism-news trends "tornado" --granularity monthly --tableCite
Fliar BI. Tornadoes in the News 2019–2026: article-level dataset and coverage tables. January 2019 – July 2026. https://fliarbi.github.io/news-datasets/tornadoes/